IBM Planning Analytics
This project includes detailed insights about how we identified and solved a crucial problem in a SaaS product Planning Analytics. During the span of 5 and a half weeks we created a detailed research and design plan to carefully execute the task at hand.
IBM Planning Analytics
This project includes detailed insights about how we identified and solved a crucial problem in a SaaS product Planning Analytics. During the span of 5 and a half weeks we created a detailed research and design plan to carefully execute the task at hand.
IBM Planning Analytics
This project includes detailed insights about how we identified and solved a crucial problem in a SaaS product Planning Analytics. During the span of 5 and a half weeks we created a detailed research and design plan to carefully execute the task at hand.
IBM Planning Analytics
This project includes detailed insights about how we identified and solved a crucial problem in a SaaS product Planning Analytics. During the span of 5 and a half weeks we created a detailed research and design plan to carefully execute the task at hand.
Role
Role
I collaborated with a team of six, encompassing Visual, UX, Research, and Content expertise. My responsibilities involved researching, strategizing, and shaping the new experience for a specified problem statement.
I collaborated with a team of six, encompassing Visual, UX, Research, and Content expertise. My responsibilities involved researching, strategizing, and shaping the new experience for a specified problem statement.
About Planing Analystics
About Planing Analystics
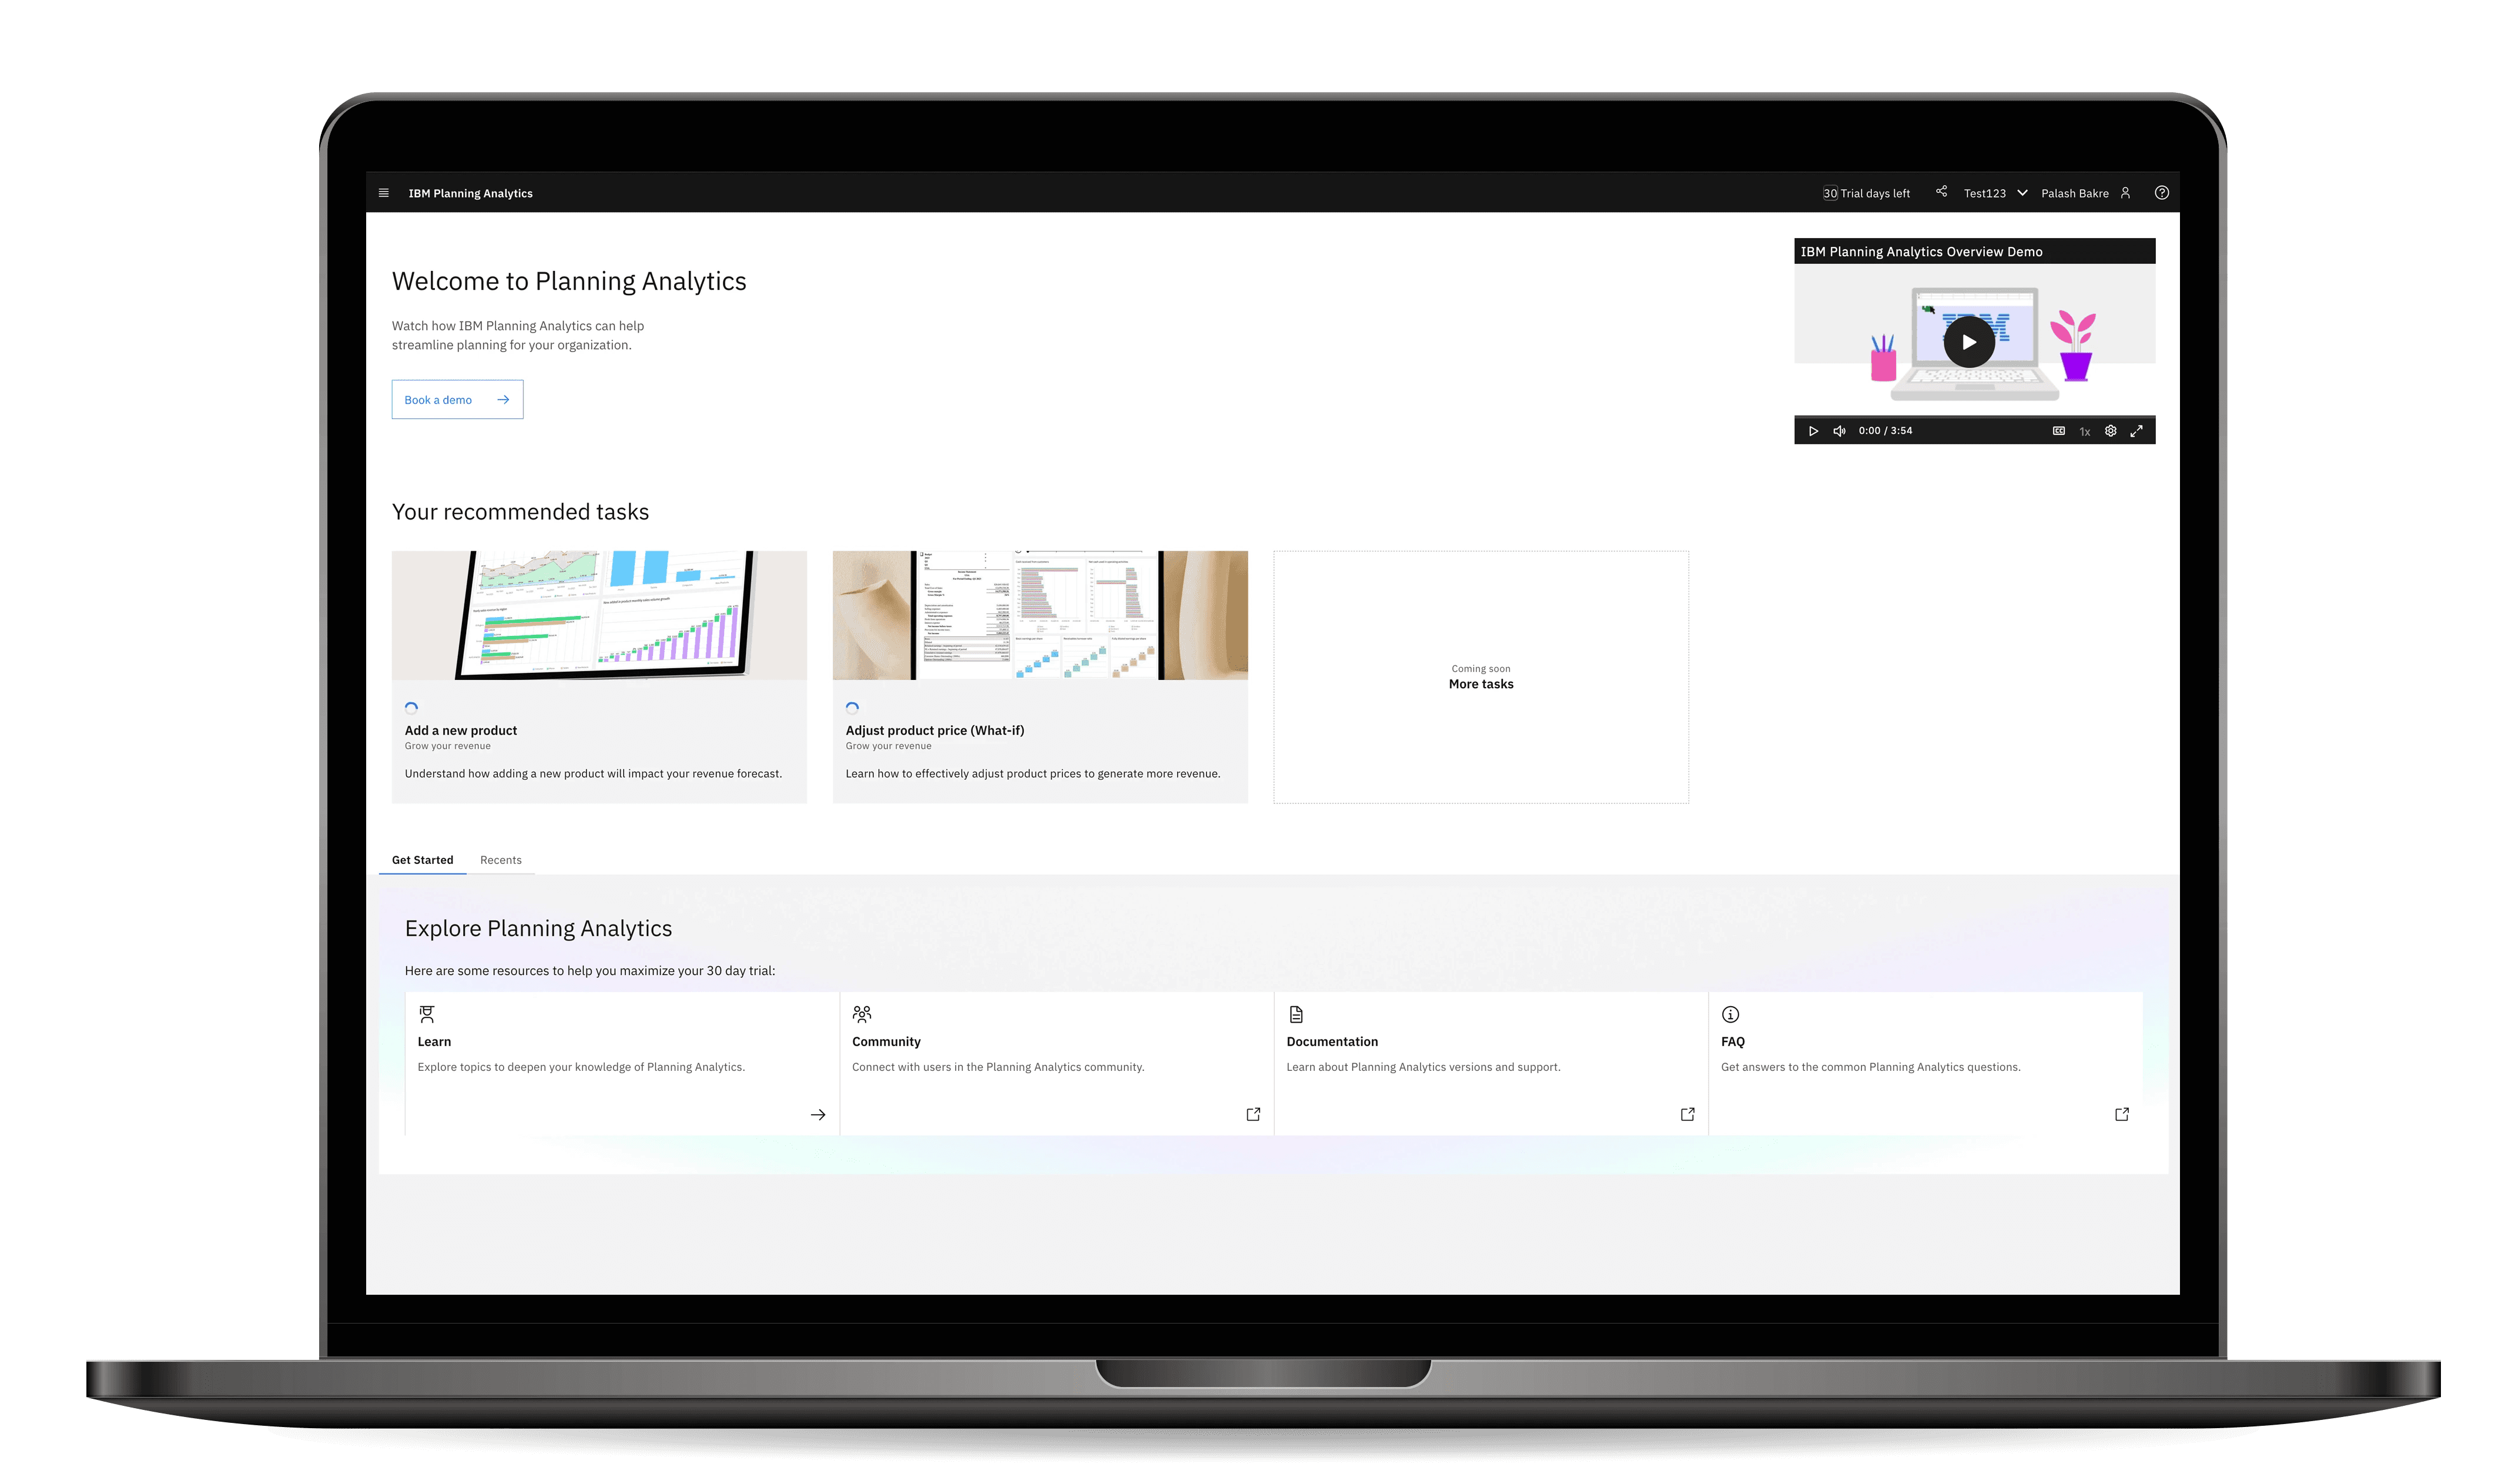
IBM Planning Analytics is an AI-infused integrated business planning solution that turns raw data into actionable insights. IBM Planning Analytics uses flexible AI forecasting to predict results. It analyzes real-time scenarios quickly, whether large scale or detailed. So you can deploy on-premises or on the cloud, including as a service on AWS.
IBM Planning Analytics is an AI-infused integrated business planning solution that turns raw data into actionable insights. IBM Planning Analytics uses flexible AI forecasting to predict results. It analyzes real-time scenarios quickly, whether large scale or detailed. So you can deploy on-premises or on the cloud, including as a service on AWS.
Understanding the users
Understanding the users
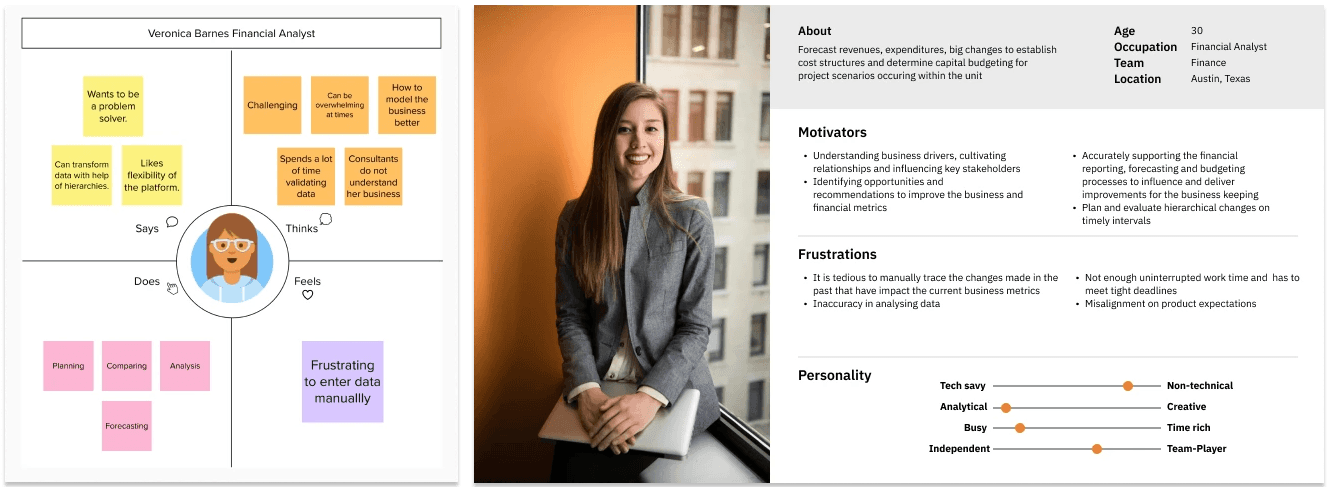
We connected with Sponsor users, PMs, and the Tech leads to really get into the nitty-gritty of our product's UI. Conducted 3 insightful user interviews and consolidated key findings in a comprehensive document. For the interviews we also created a questionnaire with 3 levels of questions having a mix of open-ended, short-formed and close-ended questions. We also made sure the time constraint the users have and adjust witht he questions accordingly.
We connected with Sponsor users, PMs, and the Tech leads to really get into the nitty-gritty of our product's UI. Conducted 3 insightful user interviews and consolidated key findings in a comprehensive document. For the interviews we also created a questionnaire with 3 levels of questions having a mix of open-ended, short-formed and close-ended questions. We also made sure the time constraint the users have and adjust witht he questions accordingly.
Competitor’s Analysis
Competitor’s Analysis
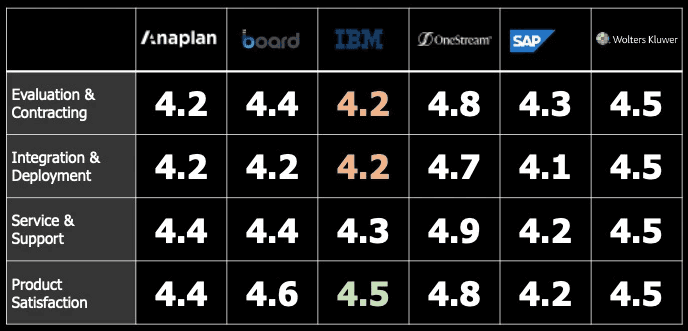
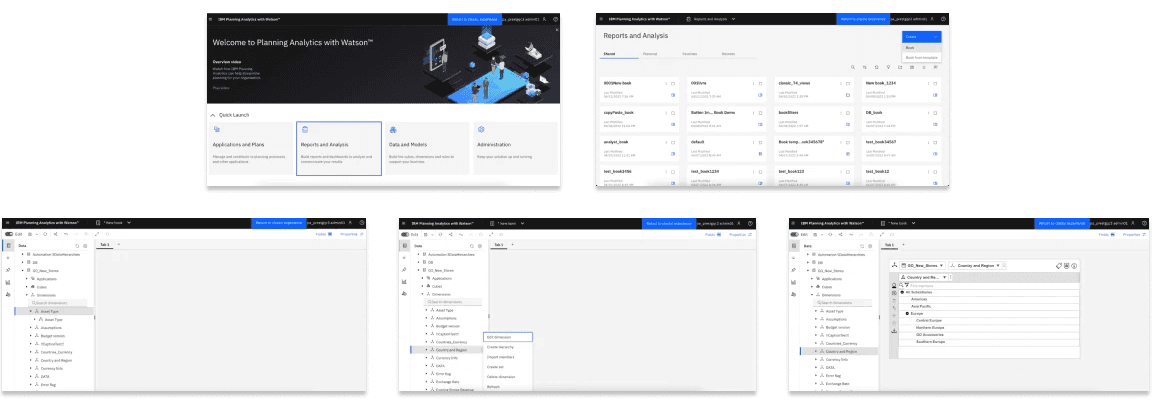
Understanding the product here in a quick and efficent way was very crucial. So, we sat down with the team to pick apart the current UI, figuring out what's working well and where we can jazz things up. Learned about competitors by analysisng about the users reviews and getting to know the product Ui's. We created a mind map of the products Ui and marked down the pain points in the flows. Made sure all the key players were on the same page by sketching out a stakeholders map. With the basics cleared up, we moved towards discovering the points and taking a deep dive to understand the core problem of the product.
Understanding the product here in a quick and efficent way was very crucial. So, we sat down with the team to pick apart the current UI, figuring out what's working well and where we can jazz things up. Learned about competitors by analysisng about the users reviews and getting to know the product Ui's. We created a mind map of the products Ui and marked down the pain points in the flows. Made sure all the key players were on the same page by sketching out a stakeholders map. With the basics cleared up, we moved towards discovering the points and taking a deep dive to understand the core problem of the product.
As - is scenario
As - is scenario
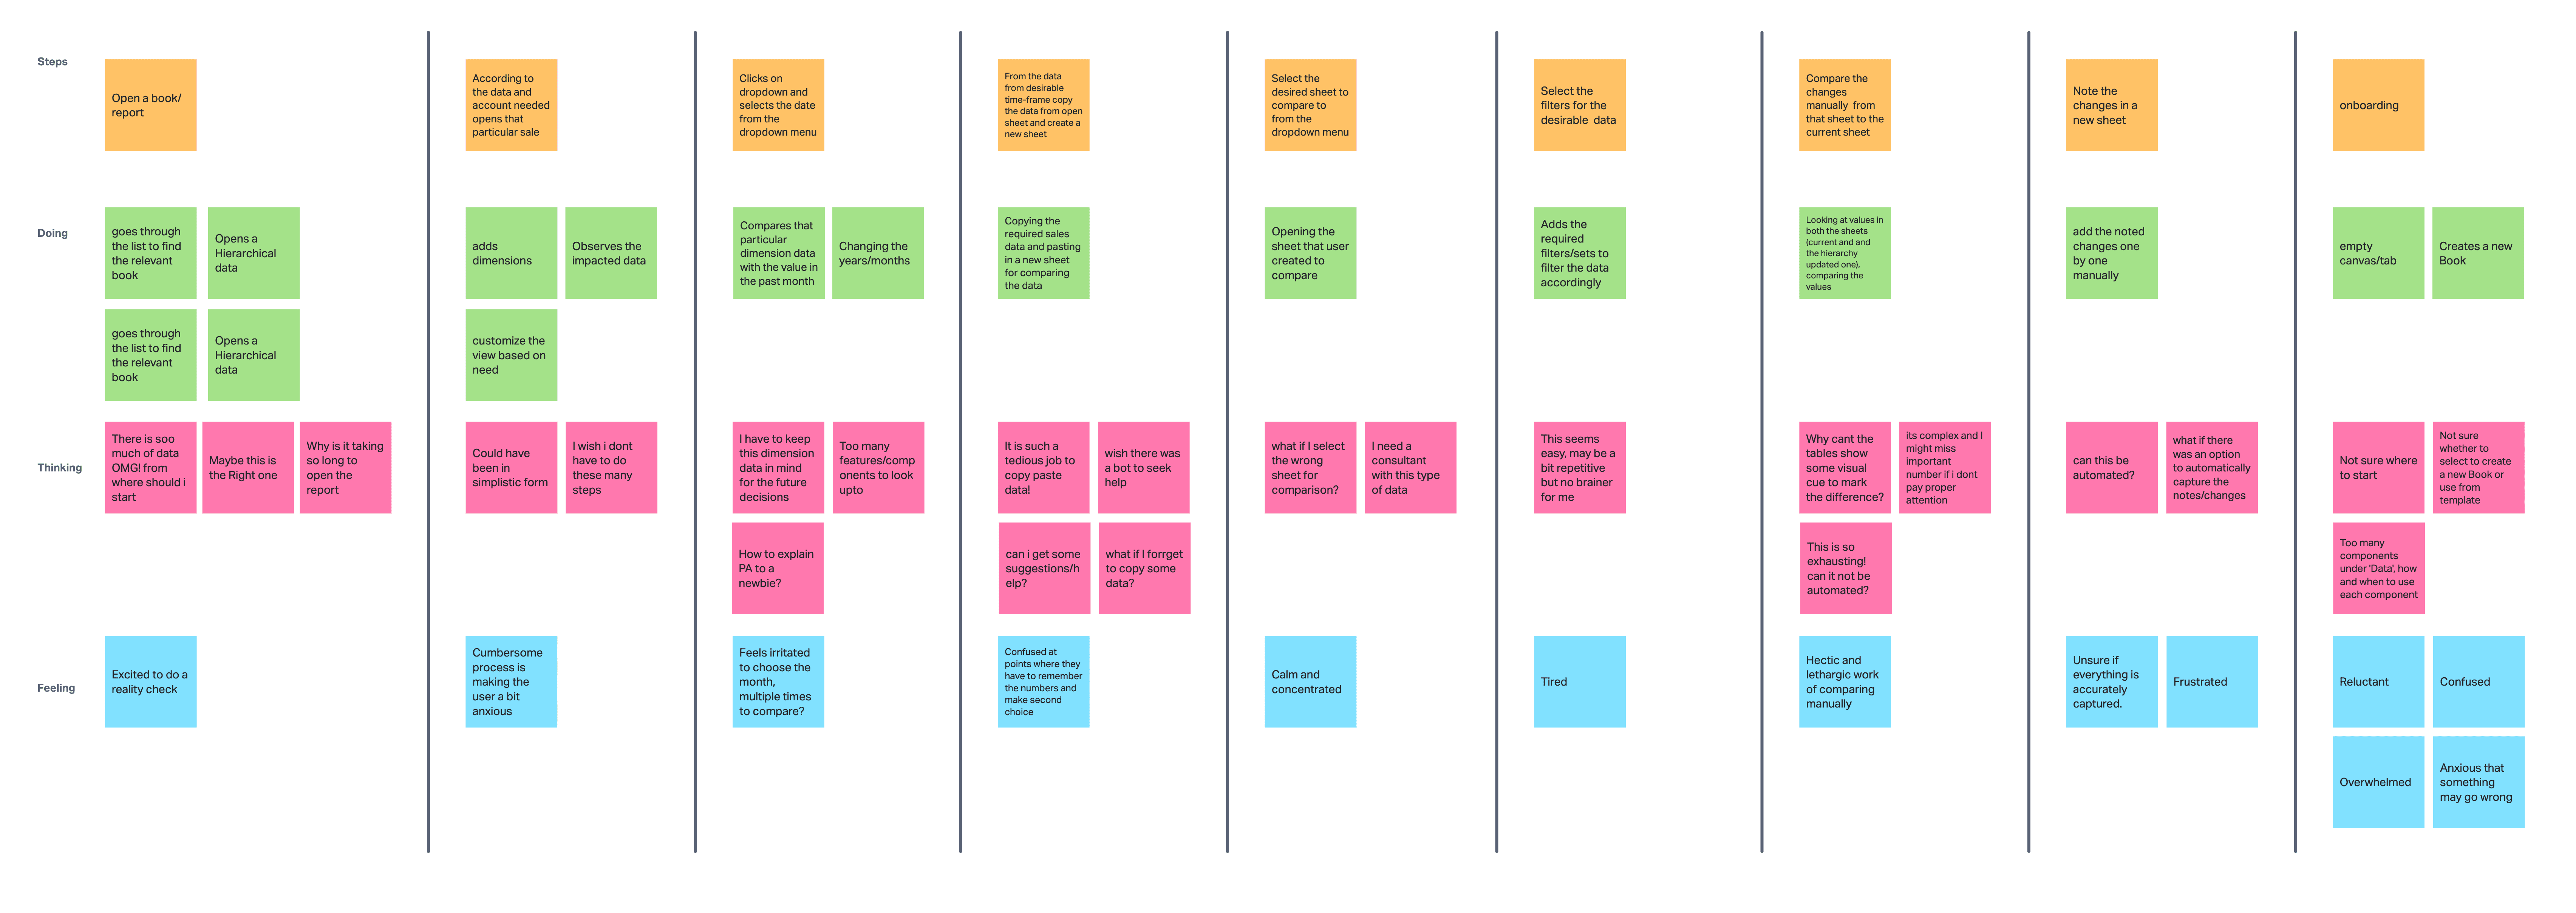
Problem Statement
Problem Statement
How can users quickly grasp the delayed impact of organizational changes on business outcomes without spending a lot of time on manual analysis? It's crucial for smart decision-making, so we need an efficient automated approach to reveal these insights promptly.
How can users quickly grasp the delayed impact of organizational changes on business outcomes without spending a lot of time on manual analysis? It's crucial for smart decision-making, so we need an efficient automated approach to reveal these insights promptly.
To - be scenario
To - be scenario

Scoping recommendations
Scoping recommendations
Due to time constraint we had to scope our project to a limited and a quick solution which can be implemented without any development load. Here are the recommendations that we gave to the team.
Have prebuilt scripted Functions
Create Self Explanatory support tool for users
Make copying large volume of data possible & Remove limitation from cubes
Sandboxing the data
Data validation from user input like MS Excel
Intelligent recommendation of the feeder data by system
Solution
Solution
We decided to create a demo version of our idea, focusing mainly on making it easier to backtrack. This means going back in time to see how things have changed. After ideation and careful analysis we came to a conclusion that manual backtracking can be altered with Ai and can be done much more easily. With the feature of adding filters to dates the users can now backrack to a specefic time period and understand the impact and analyse it. This will help them in scenario planning.
The users can change the heirarchys by adding filters. To know the past impacts the users have to select the backtrack option. From this option they can see a list of past impacts from which they can select any of see the details. They can select from more of the dimentions of rows and the coloumns in the data table to look at the impacts change.
With the impacts shown the users will look at a deata sheet which will highligh the impacted numbers. They will also be looking at a sort of dashboard where they can also look at other insights. The users will also be shown data tailored according to the filtering habits of the users.
Live Prototype
Live Prototype
Connect with me to view Planning Analytics UI Design and User Task journey
Connect with me to view Planning Analytics UI Design and User Task journey
©2024 PALASHBAKRE
GO BACK TO TOP
©2024 PALASHBAKRE
GO BACK TO TOP